Proof-of-Work (PoW) cryptocurrencies secure their networks by requiring miners to use computational resources. The total network hashrate and the efficiency of mining hardware can give us an approximate sense of each chain's energy consumption. Below, we compare four major PoW coins—Bitcoin (BTC), Bitcoin Cash (BCH), Kaspa (KAS), and Litecoin (LTC)—to see how much power their networks might be using and how that relates to each project's market capitalization.
Dimensional Analysis
For each cryptocurrency, we divide the total network hashrate by a single device's hashrate to estimate the number of devices. Then, we multiply that count by the power usage per device to arrive at an approximate network-wide power draw. All miners assessed are modern ASICs, with the following hardware:
- Bitcoin: Bitmain Antminer S21 Pro
- Bitcoin Cash: Bitmain Antminer S21 Pro
- Kaspa: Antminer KS5 Pro
- Litecoin: Fluminer L1
1. Bitcoin (BTC)
- Network Hashrate: 900 EH/s $= 900 \times 10^{18}\ \text{H/s}$
- ASIC Performance: 234 TH/s $(234 \times 10^{12}\ \text{H/s})$ at 3531 W
- Market Cap: \$1.95T $(1950\ \text{in billions})$
- Number of ASICs: $$\frac{900 \times 10^{18}\ \text{H/s}}{234 \times 10^{12}\ \text{H/s/ASIC}} \approx 3.846 \times 10^6\ \text{ASICs}$$
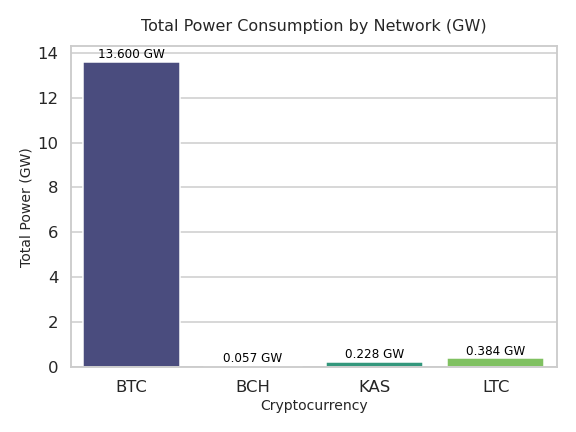
- Total Power (W): $$(3.846 \times 10^6) \times (3531\ \text{W/ASIC}) \approx 1.36 \times 10^{10}\ \text{W}$$
- Convert to GW: $$1.36 \times 10^{10}\ \text{W} = 13.6\ \text{GW}$$
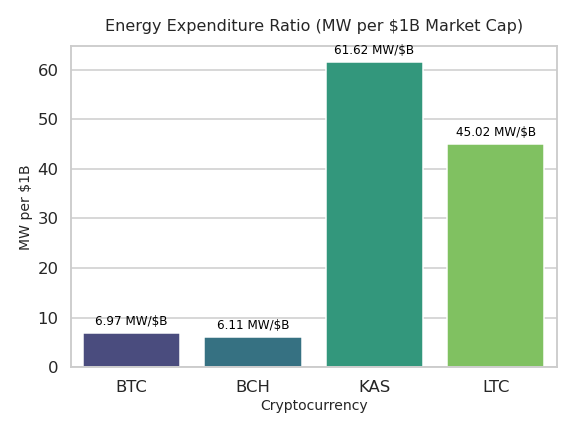
- Power per \$1B: $$\frac{13.6\ \text{GW}}{1950} \approx 0.00697\ \text{GW/\$B} \approx 7\ \text{MW/\$B}$$
2. Bitcoin Cash (BCH)
- Network Hashrate: 3.76 EH/s $= 3.76 \times 10^{18}\ \text{H/s}$
- ASIC Performance: 234 TH/s $(234 \times 10^{12}\ \text{H/s})$ at 3531 W
- Market Cap: \$9.3B
- Number of ASICs: $$\frac{3.76 \times 10^{18}\ \text{H/s}}{234 \times 10^{12}\ \text{H/s/ASIC}} \approx 1.6068 \times 10^4\ \text{ASICs}$$
- Total Power (W): $$(1.6068 \times 10^4) \times (3531\ \text{W/ASIC}) \approx 5.68 \times 10^7\ \text{W} = 0.0568\ \text{GW}$$
- Power per \$1B: $$\frac{0.0568\ \text{GW}}{9.3} \approx 0.0061\ \text{GW/\$B} \approx 6\ \text{MW/\$B}$$
3. Kaspa (KAS)
- Network Hashrate: 1.5 EH/s $= 1.5 \times 10^{18}\ \text{H/s}$
- ASIC Performance: 21 TH/s $(21 \times 10^{12}\ \text{H/s})$ at 3200 W
- Market Cap: \$3.7B
- Number of ASICs: $$\frac{1.5 \times 10^{18}\ \text{H/s}}{21 \times 10^{12}\ \text{H/s/ASIC}} = \frac{1.5}{21} \times 10^6 \approx 71{,}400\ \text{ASICs}$$
- Total Power (W): $$(71{,}400) \times (3200\ \text{W/ASIC}) \approx 2.2848 \times 10^8\ \text{W} = 0.228\ \text{GW}$$
- Power per \$1B: $$\frac{0.228\ \text{GW}}{3.7} \approx 0.0616\ \text{GW/\$B} \approx 62\ \text{MW/\$B}$$
4. Litecoin (LTC)
- Network Hashrate: 1.7 PH/s $= 1.7 \times 10^{15}\ \text{H/s}$
- ASIC Performance: 5.3 GH/s $(5.3 \times 10^{9}\ \text{H/s})$ at 1200 W
- Market Cap: \$8.53B
- Number of ASICs: $$\frac{1.7 \times 10^{15}\ \text{H/s}}{5.3 \times 10^9\ \text{H/s/ASIC}} \approx 0.32 \times 10^6 = 320{,}000\ \text{ASICs}$$
- Total Power (W): $$(320{,}000) \times (1200\ \text{W/ASIC}) = 3.84 \times 10^8\ \text{W} = 0.384\ \text{GW}$$
- Power per \$1B: $$\frac{0.384\ \text{GW}}{8.53} \approx 0.045\ \text{GW/\$B} = 45\ \text{MW/\$B}$$
| Cryptocurrency | Network Hashrate | Total Power | Market Cap (USD) | MW per \$1B Cap |
|---|---|---|---|---|
| Bitcoin (BTC) | 900 EH/s | ~13.6 GW | \$1.95T | ~7 MW/\$B |
| Bitcoin Cash (BCH) | 3.76 EH/s | ~0.0568 GW | \$9.3B | ~6 MW/\$B |
| Kaspa (KAS) | 1.5 EH/s | ~0.228 GW | $3.7B | ~62 MW/$B |
| Litecoin (LTC) | 1.7 PH/s | ~0.384 GW | $8.53B | ~45 MW/$B |
Thoughts
When comparing these ratios, it becomes evident that both Kaspa and Litecoin have a significantly higher energy expenditure relative to their market cap. Despite their smaller size, the total power consumption per billion dollars of market value is considerable. On the other hand, Bitcoin's security spend is substantially higher in an absolute sense (reaching into double-digit gigawatts), yet its massive market capitalization keeps the energy-to-value ratio lower than many smaller-cap coins.
Bitcoin Cash, although it has a relatively small market cap, does not exhibit a high energy-to-marketcap ratio akin to other smaller coins. This is likely because it shares the SHA-256 hashing scheme with Bitcoin. In effect, Bitcoin's enormous mining ecosystem places an upper bound on how much incremental energy is truly attributed to Bitcoin Cash alone. One might say that Bitcoin Cash's ratio is "capped" by Bitcoin's massive mining activity.
Why This Metric Matters: Many proponents of Proof-of-Work argue that cryptocurrency functions as a type of "hard" money precisely because securing the chain requires substantial resources. However, in this analysis, we specifically adjust for differences in modern ASIC hardware and unique hash schemes among each coin. These considerations ensure that a higher ratio of energy usage to market value does not arise simply from inefficient hashing. Rather, it accurately illustrates how much real-world energy is being invested into producing each dollar of network value. By converting a real-world commodity (energy) into digital value, PoW coins reinforce their ethos as "hard" money assets.
Future Analysis
Future research could examine historical trends to see if Bitcoin ever displayed the sort of high energy-per-$1B ratios that Kaspa currently has, especially during Bitcoin's early days of ASIC mining when its price (and market cap) was far lower. Update: We've done that here Bitcoin Mining Efficiency & Hashrate Over Time Additionally, deeper analysis could incorporate changing block rewards, historical transaction fee data, and other macroeconomic indicators to forecast how mining expenditures might evolve. Such a study would also shed light on whether these security expenditures become more (or less) sustainable over time as adoption grows.
Disclaimer: All calculations here are estimates based on indicative hashrates, hardware efficiency, and current market caps. Real-world power usage can vary significantly, and market valuations are constantly in flux. Always perform your own research and use multiple data sources before drawing conclusions.
Sources
- Bitcoin Network Hashrate: BitInfoCharts - Bitcoin Statistics
- Bitcoin Cash Network Hashrate: BitInfoCharts - Bitcoin Cash Statistics
- Kaspa Network Hashrate: Kaspa Explorer
- Litecoin Network Hashrate: BitInfoCharts - Litecoin Statistics
- ASIC Hardware Specifications: Bitmain Official Store
- Market Capitalization Data: CoinMarketCap